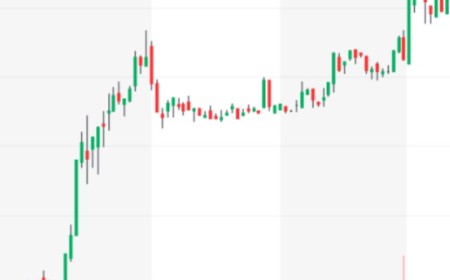
Technical Analysis Patterns: Basic Patterns in Trading

The Forex price chart is the basis of trading analysis. There are certain Forex patterns that are found on price charts and serve as the basis for various trading strategies. Even those traders who are skeptical about technical analysis still use charts to some extent in their trading. And this is not surprising: Forex charts provide traders with a wealth of information.
In this article, we will look at the most common chart patterns (figures) and show you how you can find them and use them to your advantage when trading the market!
Technical analysis figures: what is a pattern in trading
Before we begin to analyze the main figures of technical analysis, let's define what a pattern is in trading:
A pattern (in trading) is a figure (or graphical model) on a price chart that helps a trader to predict the future direction of the price movement of a trading instrument based on its behavior in the past.
With a huge variety of ways to trade Forex instruments, understanding the most common trading methods can save you a lot of time, money and effort. Using popular and simple approaches, a trader can develop an entire trading plan using commonly seen Forex chart patterns.
Let's proceed directly to the analysis of some of the most common Forex chart patterns and learn how to identify them!
Trading Patterns: Head and Shoulders pattern
You've probably seen the head and shoulders pattern in Forex, or at least heard of it, as it's quite a popular pattern and fairly easy to identify.
The head and shoulders pattern can be seen on all timeframes of currency pair charts. It belongs to trend reversal patterns. Since these chart patterns provide entry, stop loss and target price levels, it is very easy to create a Forex trading strategy based on them.
Let's look at how the head and shoulders (pattern) is formed:
The left shoulder is an increase in price, reaching a peak (top), followed by a decrease.
Head - the price rises again, forming a higher top than the left shoulder.
Right shoulder - again there is a decrease, followed by an increase, as a result of which the price reaches the right peak (below the head).
The reverse head and shoulders pattern looks the same as shown in the image above, but reversed.
It is very important to wait for the pattern to complete after the formation of the neckline (gray dotted line below the pattern) that connects the two lows of the pattern or the two highs of the reversed head and shoulders pattern: no trades should be made until the pattern has broken through the neckline.
The most common entry point is a breakout of the neckline with a stop loss set above or below the right shoulder, depending on whether the pattern is regular or inverted.
As for the profit target, for a regular head and shoulders pattern, you need to determine the difference between the price high of the head and the lowest point of both shoulders, then this figure must be subtracted from the entry price.
For the inverted head and shoulders pattern, the process is reversed. The price low of the head is subtracted from the high of the shoulders, after which the resulting figure is added to the breakout price.
Although this system is not perfect, it does suggest a logical price movement approach to trading the markets.
Trading Patterns: Triangle Pattern
A trading triangle can indicate both trend continuation and reversal, so triangle patterns are defined as trend reversal and continuation patterns.
The triangle pattern consists of two trend lines: a straight line and an up/down trend line. Price moves within these two trendlines before eventually breaking out.
There are three types of “triangle” figures in trading, which differ in their meaning and construction:
- symmetrical triangle
- ascending triangle
- Descending triangle
- symmetrical triangle
Let's start with the symmetrical triangle, which is often considered a trend continuation chart pattern that signals a period of market consolidation followed by a resumption of the previous trend. It is formed by a descending resistance line and an ascending support line.
The two trend lines in a triangle pattern are sloping and converge at a point commonly referred to as a top. The price will trade inside the pattern, between these two trend lines, towards the top, after which, as a rule, it breaks the line in the direction of the previous trend.
If the pattern was preceded by a downtrend, the trader's task is to concentrate on breaking through the ascending support line down. However, if the symmetrical triangle pattern was preceded by an uptrend, the next step would be to break the downtrend resistance line up.
It is important to note that although this technical analysis pattern usually suggests a continuation of the previous trend, this is not always the case. A break in the opposite direction to the previous one will signal the formation of a new trend.
Аscending triangle
The ascending triangle pattern is a bullish Forex pattern that indicates that the price is moving up. This pattern is formed by two trend lines: the straight trend line is the resistance point, and the rising trend line is the support.
The price moves between these trend lines until it breaks one of them, usually an up resistance line. These Forex chart patterns are usually preceded by an uptrend, making them trend continuation Forex patterns.
Descending triangle
The descending triangle pattern is the opposite of the ascending triangle pattern. It gives Forex traders a bearish signal, informing that the price is likely to decline after the final formation of the pattern, i.e. breaking through the support line. This pattern consists of a straight support line and a falling resistance line.
Like the ascending triangle, this pattern is considered a trend continuation pattern as it is usually preceded by a downtrend.
It is important to note that this is not always the case, and as with all triangle patterns, price will not break in the expected direction every time. This is why it is extremely important to set a stop loss when trading - as part of a risk management strategy - to protect yourself from the unpleasant consequences of unexpected price movements.
Trading Patterns: Engulfing Candle Patterns
Japanese candlestick charts provide much more information than simple line charts. Since there are many Forex chart patterns, we suggest paying attention to a trading strategy based on a pattern that can be easily found on a chart.
The engulfing candlestick pattern represents an excellent trading opportunity, and price movement indicates a strong and immediate change in trend direction.
In a downtrend, the real body (i.e., the space between the open and close price) of an up candle completely engulfs the real body of the previous down candle. This is a bullish engulfing pattern. Conversely, in an uptrend, the real body of the down candle completely engulfs the real body of the previous up candle. This is a bearish engulfing pattern.
These patterns are very reliable as the price action clearly indicates a trend reversal as the previous candle is already completely reversed.
Traders can enter the market at the start of a potential trend by placing a stop loss above the previous pivot point where the pattern occurred if the engulfing pattern is bearish. When trading a bullish engulfing pattern pattern, a stop loss should be placed below the low of the previous reversal.
Conclusion
There is a wide range of approaches that use technical analysis patterns to find entry points to the market and place a stop loss.
The head and shoulders patterns and the triangle help to determine the levels for opening a position, setting a stop loss and determining profit targets within the pattern.
Forex pattern "engulfing candle" indicates a trend reversal, providing a potential opportunity to enter the market at the very beginning of a new trend with an already defined entry level and stop loss.
An experienced trader can take advantage of combining all these well known models and methods and create their own unique trading strategy.
You can also familiarize yourself with fraudulent brokers.


Post a Comment